

September 2026
by Ernesto Hernandez Jr., Associate Professor and Student Access & Success Librarian and Wendy Holliday, Dean of the Library and Academic Support.
Background
In Spring 2026, Stewart Library conducted a survey of Weber State University (WSU) students to assess whether the library space and services are welcoming and meet the needs of our diverse student body. This survey was a close replication of a prior study conducted by Thomas & Houlihan (2025) on students' perceptions of their sense of belonging in an academic library.
By collecting data about physical library spaces, collections, programming, and staff interactions, we hoped to learn about what aspects of the library make them feel welcome and supported and to identify and address any hidden institutional barriers that make students feel excluded or unseen. The results of this study will help guide us in developing Stewart Library's new strategic plan in 2027.
Survey Method
The survey was distributed via email to a sample of all matriculated, degree-seeking undergraduate and graduate students across Weber State University. The survey was open for one month, running from March 9 through April 9, 2025. We successfully gathered 139 completed responses. Designed as a mixed-methods instrument, the survey incorporated both quantitative metrics and qualitative inquiry to build a comprehensive picture of student experiences.
The survey collected demographic data including age, gender identity, race/ethnicity, first-generation status, and disability status to analyze response patterns across student groups. The quantitative component also utilized Likert scales and rating grids to evaluate visit frequencies, perceptions of physical and emotional safety, instances of microaggressions, and the helpfulness of key library services.
Qualitatively, the survey integrated open-ended response fields to capture feedback directly from respondents in their own words. These qualitative prompts specifically invited students to share how Stewart Library can better represent multiple perspectives in its physical spaces and suggest new offerings to cultivate a more welcoming environment. We received only 20 qualitative comments, so they are not representative, but they helped provide context for the survey results. The complete survey questions are provided in Appendix A.
Results
In general, the quantitative and qualitative responses suggest that most respondents find the library a welcoming place. There were several open-ended comments that were generally positive, such as "everything is good." There were some general suggestions related to library furnishings and study spaces, including a need for more study rooms, more spaces that are friendly to collaborative work, more soft seating, earlier morning hours, and more programming related to leisure reading, such as a book club.
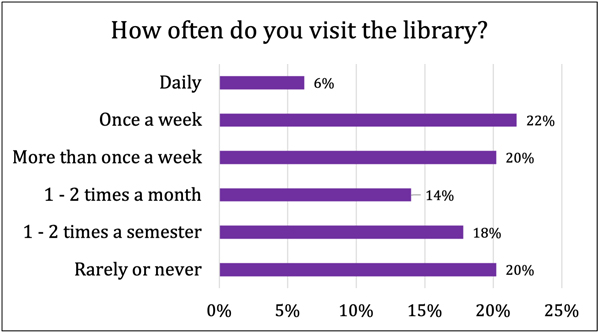
Frequency of Library Visits: How often do you visit the library?
Respondents provided a range of answers, which is an expected result because of the many ways that students use the library. Some visit frequently to use the study spaces and testing center, while others with substantial off-campus commitments might visit less frequently to check out materials or technology. Only 20% of students said they rarely or never visit the library and 48% of respondents visit the library either daily, once a week, or more than once a week. This suggests that, at least in this small sample of students, the library is a regular part of their campus routine. A follow up survey of students using the library at multiple times throughout the semester could help assess how students are using library spaces and services more specifically.
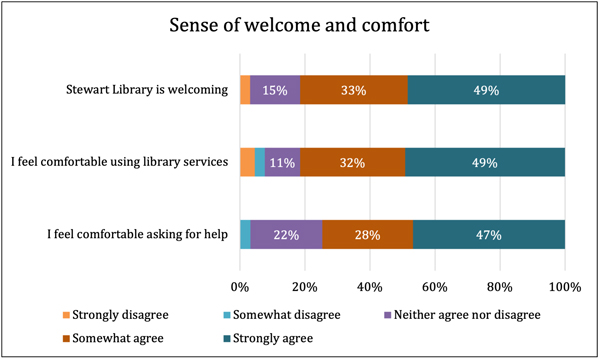
Sense of welcome
Most respondents find the library is a welcoming place, with 82% stating that they strongly or somewhat agree that the library is a welcoming place. 81% of respondents strongly or somewhat agree that they feel comfortable using library services and 75% answered that they strongly agree or somewhat agree that they feel comfortable asking for help. For the latter question, there was a notable increase in the number of people (22%) who felt neutral about their comfort in asking for help. This might be a result of lack of awareness about where to go for help or about what kind of help is available in the library. In the open, qualitative comments, one student remarked that they were too intimidated to ask for help.
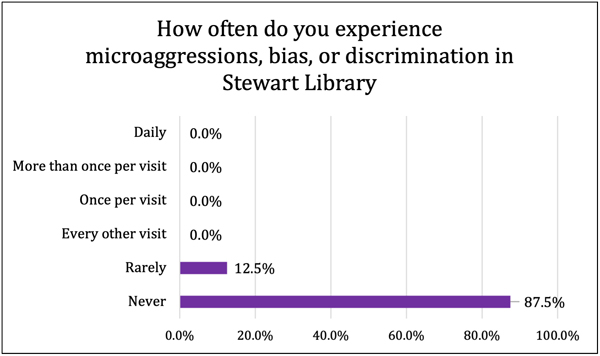
Bias and discrimination
Most respondents (87.5%) reported that they have never experienced microaggressions, bias, or discrimination in the library. The remaining respondents said that these experiences rarely occurred. Given the small sample size, this warrants some caution. More than 10% reported an experience of negative experience of bias or discrimination. The library experienced multiple incidents of book vandalism with racist and antisemitic images and messages in the past few years. We need to step up efforts to monitor our collections and spaces for such messages and learn more about what students are experiencing in order to improve training and other strategies to prevent discriminatory experiences in the library.
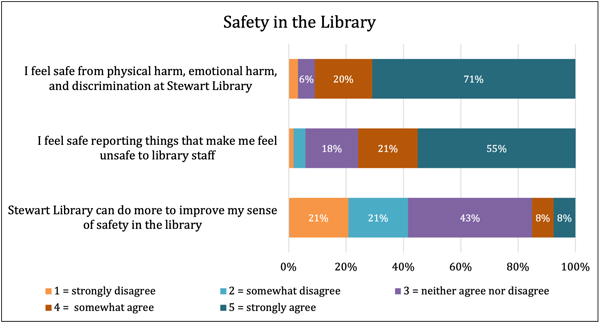
Safety
Ninety-one percent of respondents reported that they strongly agree or somewhat agree that they feel safe from physical and emotional harm and discrimination in the library. A slight smaller percentage (76%) reported the same level of comfort with reporting things that make them feel unsafe in the library, with an increase in neutral responses (18% compared to 6%). For the question about whether the library could do more to improve their sense of safety, 42% of respondents selected disagree or somewhat disagree, suggesting that they think the library is generally doing enough in this area. Nearly an equal number were neutral (43%), suggesting an uncertainty about what the library might do or could be persuaded to do to improve safety. Sixteen percent of respondents said that the library could do more to improve safety. A follow-up qualitative survey of library users might be warranted to identify specific areas of concern and improvement.
Multiple perspectives
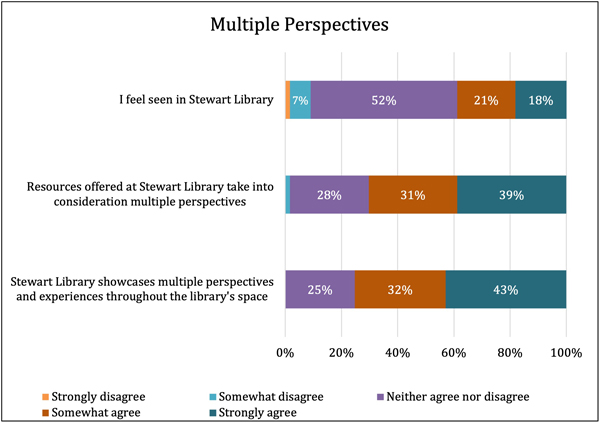
Thirty-nine percent of respondents said that they agree or strongly agree with the statement: "I feel seen in Stewart Library." Most respondents (52%) were neutral about this statement. This could reflect that students don't really think about "being seen" in the library, such as seeing people like themselves represented in the staff, the artwork, and the collection. Some students might be using the library as a study space or to visit the Testing Center, so this question didn't elicit a meaningful response. It is worthy of follow-up investigation. Most students did, however, see the library collections and space as representing multiple perspectives. Seventy percent agreed or strongly agreed that resources at the library take into consideration multiple perspectives and 75% agreed or strongly agreed that the library showcases multiple experiences and perspectives throughout the library space.
Service use
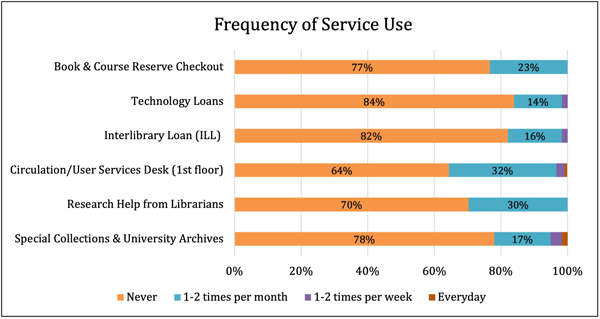
Most respondents do not use library services on a regular basis. Some services, such as technology loans, interlibrary loan, and Special Collections and University Archives (SCUA), are more likely to be used by a smaller and specialized audience. The low use rate of book checkout aligns with circulation data that suggests students at Weber State check out books at a lower rate than peer institutions. In 2024, the last date when peer data is available, usage of all library materials (physical and electronic) was 21 uses per student FTE as compared to 30 uses at peer institutions.
The most used service was the User Services desk on the first floor, where students can check out books, including course reserves, and get basic library help, including directions. 32% of respondents reported using this service 1-2 times per month and 3% reporting using this service 1-2 times per week. The Research Help desk was close behind, with 30% reporting use 1-2 times per month. All of this suggests that respondents might be using the library more often as a study space than for accessing library services. It might also suggest a preference for electronic resources and use of online help services. Using national benchmark data, our students use virtual library help services (chat and email help) about as often as at peer institutions.
A few of the open-ended responses included comments about wanting library services to be better advertised because they aren't sure about what is available. One student suggested a list of all library services near the entrance, with printed sheets available for how to use various services.
Helpfulness of Services
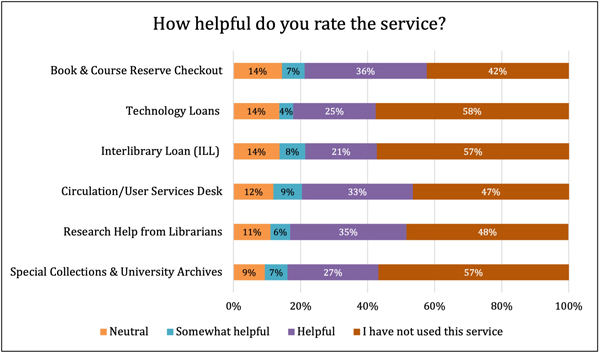
Most students who used a service found it helpful or somewhat helpful. No students rated any service as somewhat not helpful or not helpful. Between 9% and 14% of students rated the helpfulness as neutral. It could be that students aren't seeing the full impact of the service because they are not making a connection between checking out a book or getting a question answered at the Research Help desk and their academic success. It could reflect a somewhat superficial engagement with library services. This deserves further qualitative follow-up to find out why students do or don't use different library services and why they do or do not find them helpful.
Recommendations
Bias & Safety
10% of respondents reported a negative experience of bias or discrimination. In addition, approximately 16% of respondents felt the library could do more for safety. While the numbers might seem small, they are significant and the library has a responsibility to improve in this area. We commit to the following:
- We have been more vigilant in examining the print book collection for vandalism on a regular basis, but we can step up these efforts.
- Creating an anonymous and easily accessible reporting option via a QR code displayed on table toppers, at our service desks, and in restrooms. The QR code can also provide relevant safety information from WSU and the Stewart Library.
- Reinforce the university's required Discrimination, Harassment & Sexual Misconduct Prevention training with additional updates relevant to the library context, including de-escalation training for all front-line personnel and student-assistants.
- Conducting a follow-up survey of library users to determine what else the library could do to improve a feeling of safety.
Help Services
Although most respondents find the library a welcoming place, 25% of respondents felt neutral or don't feel comfortable asking for help. We commit to enhancing our point-of-need signage and website information to more clearly indicate the help services offered in the library. The Web Committee is currently exploring ways to make it more clear how to get help virtually and in the building from a more effective landing page on the library website.
Service Use and Academic Success
Most respondents did not use library services, possibly reflecting a lack of awareness. More effective promotional campaigns and curricular integrations could highlight high-value offerings like course reserves and the textbook lending library. We will also explore ways to link library services and resources to positive outcomes, including improved academic outcomes, as well as time and money saved. Faculty are our most effective partners in communicating the value of the library to academic success, so the most promising strategy is to work with faculty outside of the library to integrate library resources and services into courses themselves so that students can make the connection between library resources and services and their learning.
"Feeling seen"
We will build on the 39% of students who currently feel "seen" in the library by continuing rotating exhibits and programs. We will continue to showcase our inclusive collections through book displays and coordinated programming with cultural heritage months. We will expand student-created exhibits and programs. We will also continue to proactively recruit student workers from underrepresented populations in order to ensure that our student assistants reflect our diverse student body.
Follow-up survey and other data gathering
The survey reached a small sample of students so we need to find ways to regularly check in with students and learn more about how they are experiencing library spaces, services, and collections. We will explore deploying quick pulse surveys of library users at different points in the academic semester to better understand student needs in a more targeted way, as well as targeted surveys of library users on specific questions that emerged from these results.
Acknowledgements
We extend our sincere gratitude to Gail Niklason, Ed.D., Executive Director of the Office of Institutional Effectiveness, for her invaluable assistance in setting up and maintaining the Library Space Survey through Qualtrics. Additionally, we are deeply grateful to Dr. Azenett Garza Caballero, Professor in the Department of Psychological Science, for her expert assistance in helping us analyze the survey results.
References
Thomas, K., & Houlihan, M. (2025). Finding your place: assessing diversity, equity, and inclusion in an academic library. Evidence Based Library and Information Practice, 20(1), 117–147.
https://doi.org/10.18438/eblip30569
Appendix: Library Belonging Survey
Q1. Please select your age range.
- Under 18
- 18-24
- 25-34
- 45-54
- 55+
- Prefer not to disclose
Q2. Please select your educational standing.
- Undergraduate student
- Graduate student
Q3. Please identify your gender. Check all that apply.
- Woman
- Man
- Non-binary / Gender Queer / Gender Non-Conforming
- Trans / Transgender
- Cisgender
- Agender
- Two Spirit
- The gender I most closely align with is not listed (please specify)
- Prefer not to disclose
Q4. Please identify your race/ethnicity. Check all that apply.
- White
- Black or African American
- Latina, Latinx, Latino
- Indigenous, First Nations, American Indian, or Alaskan Native
- Asian (including East Asian, South Asian, Southeast Asian)
- Native Hawaiian or other Pacific Islander
- Arab, Persian, or other peoples of the "Middle East"
- Prefer not to disclose
- Other (please specify) __________________________________________________
Q5. Please identify your sexual orientation. Check all that apply.
- Straight / Heterosexual
- Gay or Lesbian
- Bisexual
- Queer
- Asexual
- Prefer to self-describe: __________________________________________________
- Prefer not to disclose
Q6. Are you a first-generation college student?
- Yes
- Maybe
- No
Q7. Do you identify as a person with a disability?
- Yes
- No
- Unsure
- Prefer not to disclose
Q8. How often do you visit Stewart Library?
- Daily
- More than once a week
- Once a week
- 1-2 times a month
- 1-2 times a semester
- Rarely or never
Q9. Please rate how much you agree with the following statements.
| Statement | Strongly disagree | Somewhat disagree | Neither agree nor disagree | Somewhat agree | Strongly agree |
|---|---|---|---|---|---|
| Stewart Library is welcoming | |||||
| I feel comfortable using library services. | |||||
| I feel comfortable asking for help. |
The next section of the survey will be about microaggressions, biases, and discrimination.
Microaggressions are defined as verbal, behavioral, and environmental actions that are often brief, and whether intentional or unintentional, come across as derogatory, hostile, or include negative racial slights and insults towards people of color (Sue et. Al, 2007).
Q10. How often do you experience microaggressions, bias, or discrimination in the Stewart Library?
- Daily
- More than once per visit
- Once per visit
- Every other visit
- Rarely
- Never
Q11. Please rate how much you agree with the following statements.
| Statement | Strongly disagree | Somewhat disagree | Neither agree nor disagree | Somewhat agree | Strongly agree |
|---|---|---|---|---|---|
| I feel safe from physical harm, emotional harm, and discrimination at Stewart Library. | |||||
| I feel safe reporting things that make me feel unsafe to library staff. | |||||
| Stewart Library can do more to improve my sense of safety in the library. |
Q12. Please rate how much you agree with the following statements.
| Statement | Strongly disagree | Somewhat disagree | Neither agree nor disagree | Somewhat agree | Strongly agree |
|---|---|---|---|---|---|
| I feel seen in Stewart Library. | |||||
| Resources offered at Stewart Library take into consideration multiple perspectives. | |||||
| Stewart Library showcases multiple perspectives and experiences throughout the library's space. |
Q13. How can we better represent multiple perspectives in Stewart library spaces?
The next section of the survey will address the various services the Stewart Library offers.
Q14. Please rate how often you use each service in Stewart Library.
| Service | Never | 1-2 times per month | 1-2 times per week | Everyday |
|---|---|---|---|---|
| Book and Course Reserve checkout | ||||
| Technology Loans (laptops, etc.) | ||||
| Interlibrary Loan (ILL) (checking out materials from other libraries) | ||||
| Circulation/User Services Desk (1st floor) | ||||
| Research Help from Librarians | ||||
| Special Collections and University Archives |
Q15. Please rate how helpful you believe each service is in Stewart Library.
| Service | Not helpful | Neutral | Somewhat helpful | Helpful | I have not used this service |
|---|---|---|---|---|---|
| Book and Course Reserve checkout | |||||
| Technology Loans (laptops, etc.) | |||||
| Interlibrary Loan (ILL) (checking out materials from other libraries) | |||||
| Circulation/User Services Desk (1st floor) | |||||
| Research Help from Librarians | |||||
| Special Collections and University Archives |
Q16. What services do you believe Stewart Library can add to become a more welcoming space? Is there anything else you would like to tell us about Stewart Library?